

Story By Tracy Dickinson | March 2026
Les Sulgrove shared his annual state of the market update.
At the annual Des Moines Area Association of REALTORS® Young Professionals Network (YPN) brunch held at Embassy Club West in February, Des Moines’ favorite “Stat Guy” led a walk through the metro’s real estate statistics for 2025. As always, Les Sulgrove, Statewide Housing Analyst for Iowa REALTORS®, managed to make an hour of statistics entertaining.
“This is one of my favorite events each year,” Sulgrove said, and his presentation made that clear. In addition to cracking jokes and interacting with the audience, Sulgrove offered a wealth of data to help area real estate professionals better serve their clients in the year ahead.
“I always open with the previous year’s predictions and close with my predictions for the current year,” he said. “My record for last year was not that great, so I’m hoping my 2026 predictions are closer to the mark.”
Sulgrove might be his own harshest critic in that regard. His misses were not far off target, but that’s what makes him the metro’s favorite Stat Guy. Details matter, and he pays close attention to all of them.
“I’ve made some changes to the dashboard on my DesMoinesMarketValues.com site based on feedback from users. You’ll now find a Snapshot of the Week that highlights week-by-week trends in a single graphic,” he announced.
To help users quickly compare trends, the colorful graphic includes not only weekly stats for the year to date, but the previous year’s data as well. It breaks down pricing stats into several categories; looks at listings, offers, and closings; and even tracks mortgage interest rates.
At the February YPN event, Sulgrove took a closer look at each of those items, comparing them to the previous year and to nearly two decades of data he has collected.
“Overall sales typically break down to 80% existing homes, 20% new construction. Last year, 82% of sales were existing properties and 18% were new construction,” Sulgrove said. “So even though there was a slight percentage drop for new construction, we were still well within normal ranges.”
Another statistic that surprised some attendees was the number of open houses held each week. The impression within the real estate market is that open houses are declining as potential buyers do their research online. However, Sulgrove says the statistics indicate otherwise.
“About 1,200 open houses took place each week, and there wasn’t a lot of fluctuation over the course of the year. Buyers are still taking advantage of those for both existing properties and new construction.”
Total inventory grew steadily each month, remaining consistently above 2024 numbers, and peaked at about 4,500 units, matching the 2012 numbers for the first time. Even the COVID peak didn’t quite equal 2012 inventories.
“The one category that struggled in 2025 was new condos and townhomes,” Sulgrove said. “Those rarely hit 2024 numbers and never surpassed them.”
Another statistic that stood out from 2025 was the Months of Inventory broken down by price range. Sulgrove said there was a clear demarcation between seller’s market and buyer’s market when looking at all homes sold, and price point was a key factor.
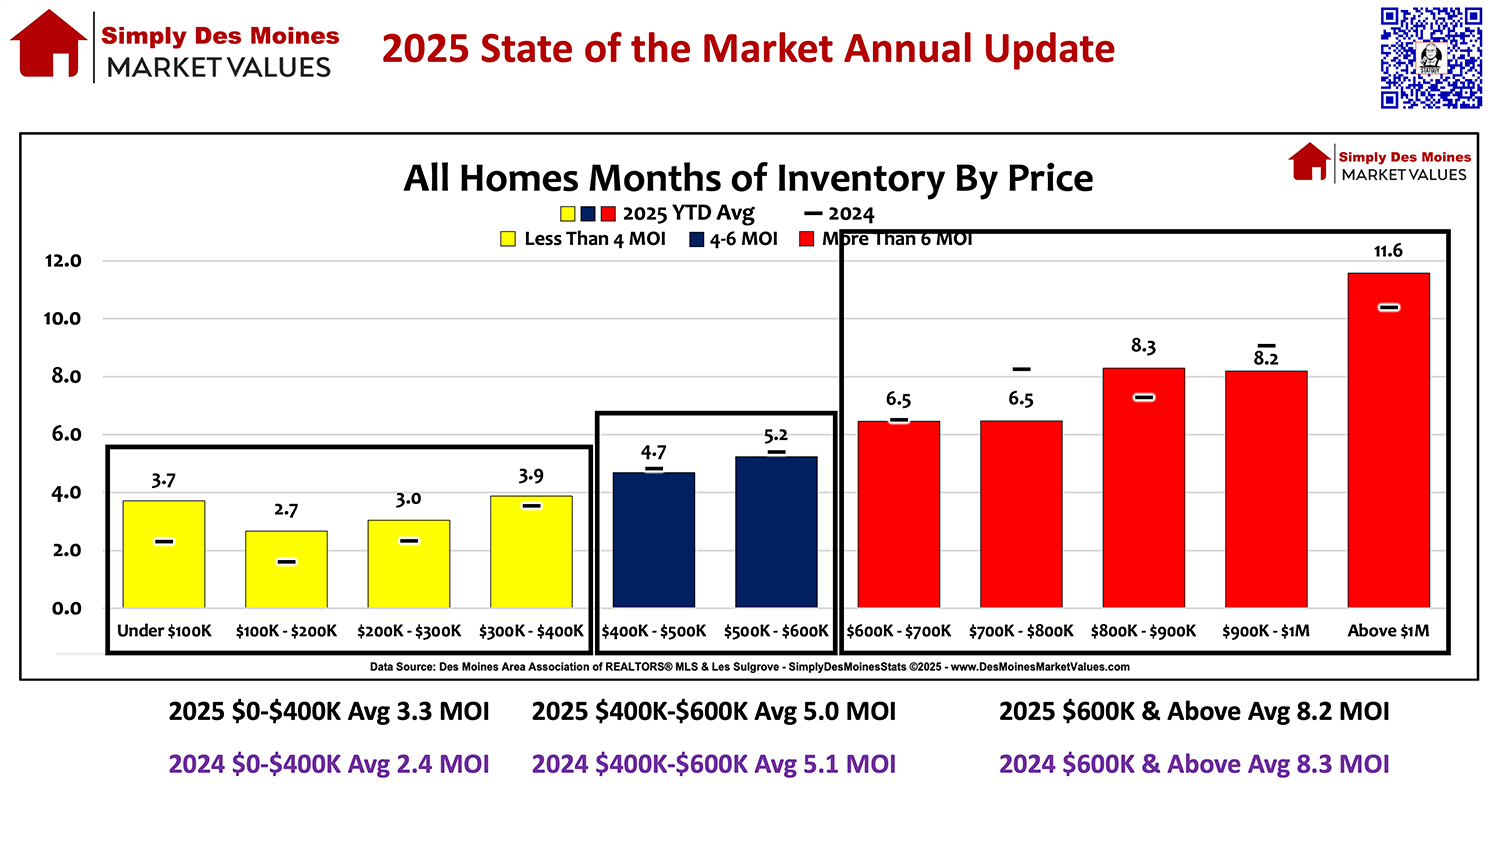
“Homes under $400,000 had just three months of inventory, but homes over $600,000 averaged over eight months of inventory,” he said. “That’s a definite seller’s market under $400,000 and a buyer’s market over $600,000.”
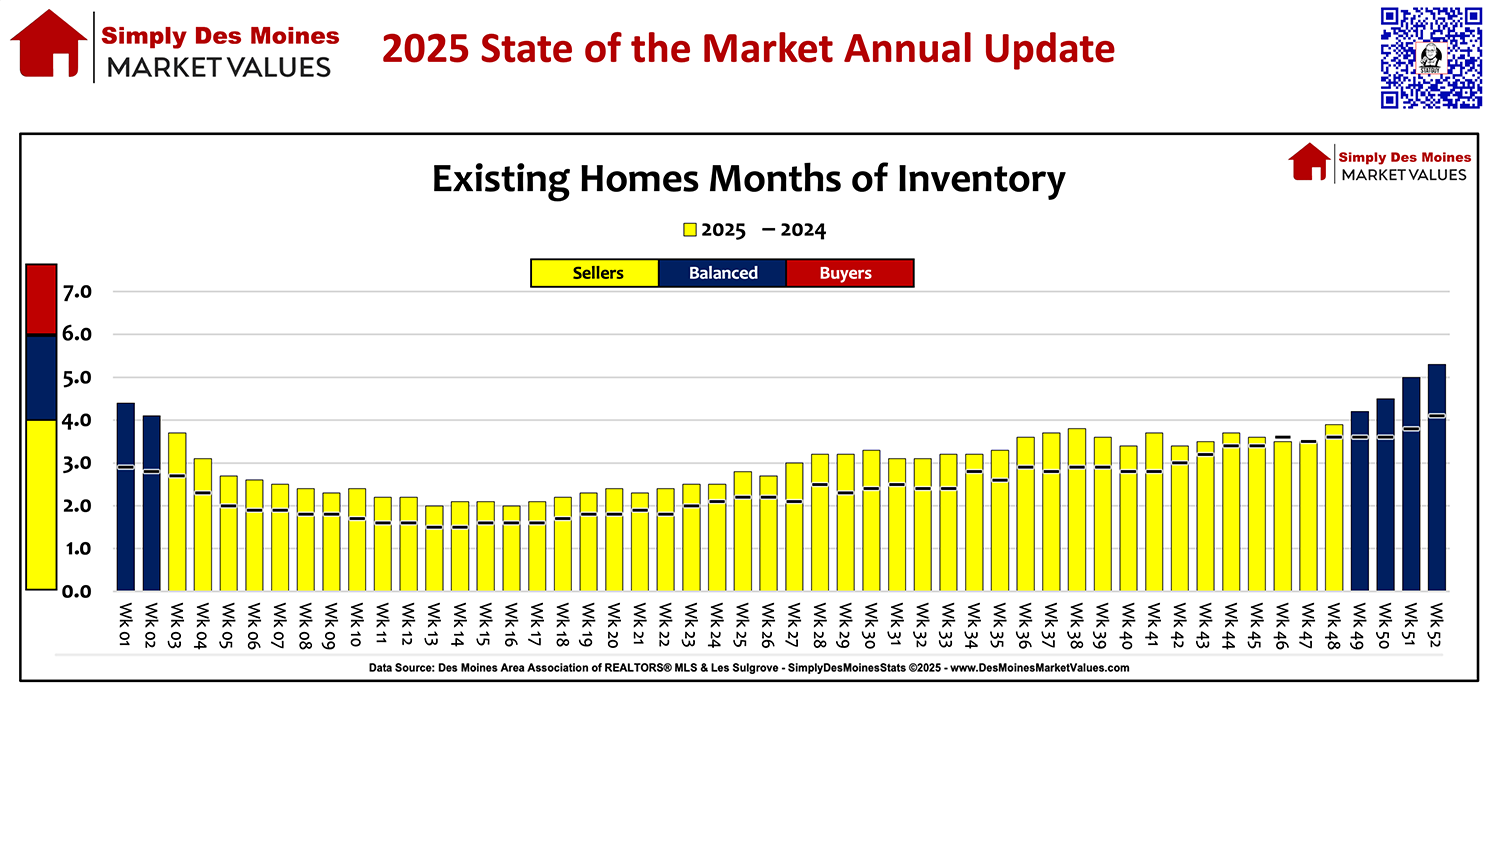
Sulgrove says when it came to new construction, “It was a buyer’s market for most of 2025. We just had a bit too much inventory and too many buyers sitting on the fence.”
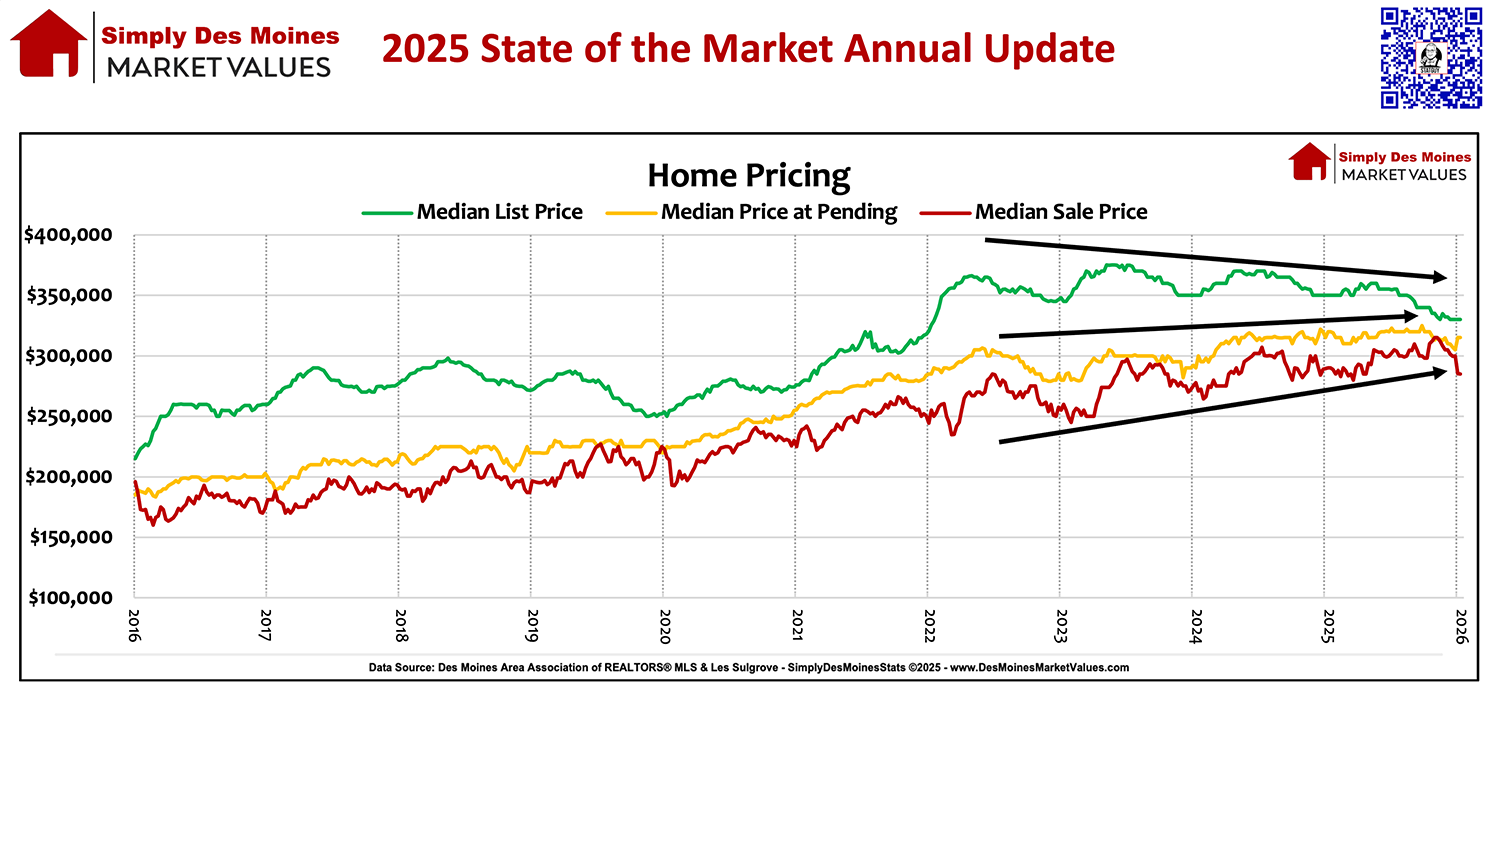
That being said, Sulgrove sees a lot of positive signs as the first quarter of 2026 comes to a close. “When you look at the relationship between List Price, Price at Pending, and Price at Closing, there’s been a significant gap in those numbers over the past decade. But as 2025 wound down and so far in 2026, there’s a much smaller gap between list price and closing price, and that’s an indication of a more balanced market.”
He said the closing of that gap was in large part because list prices dropped slowly during the second half of last year, coming more in line with the market. “The median sale price has risen each year, but the increase from 2024 to 2025 was closer to cost-of-living increases, and that’s more typical historically.”
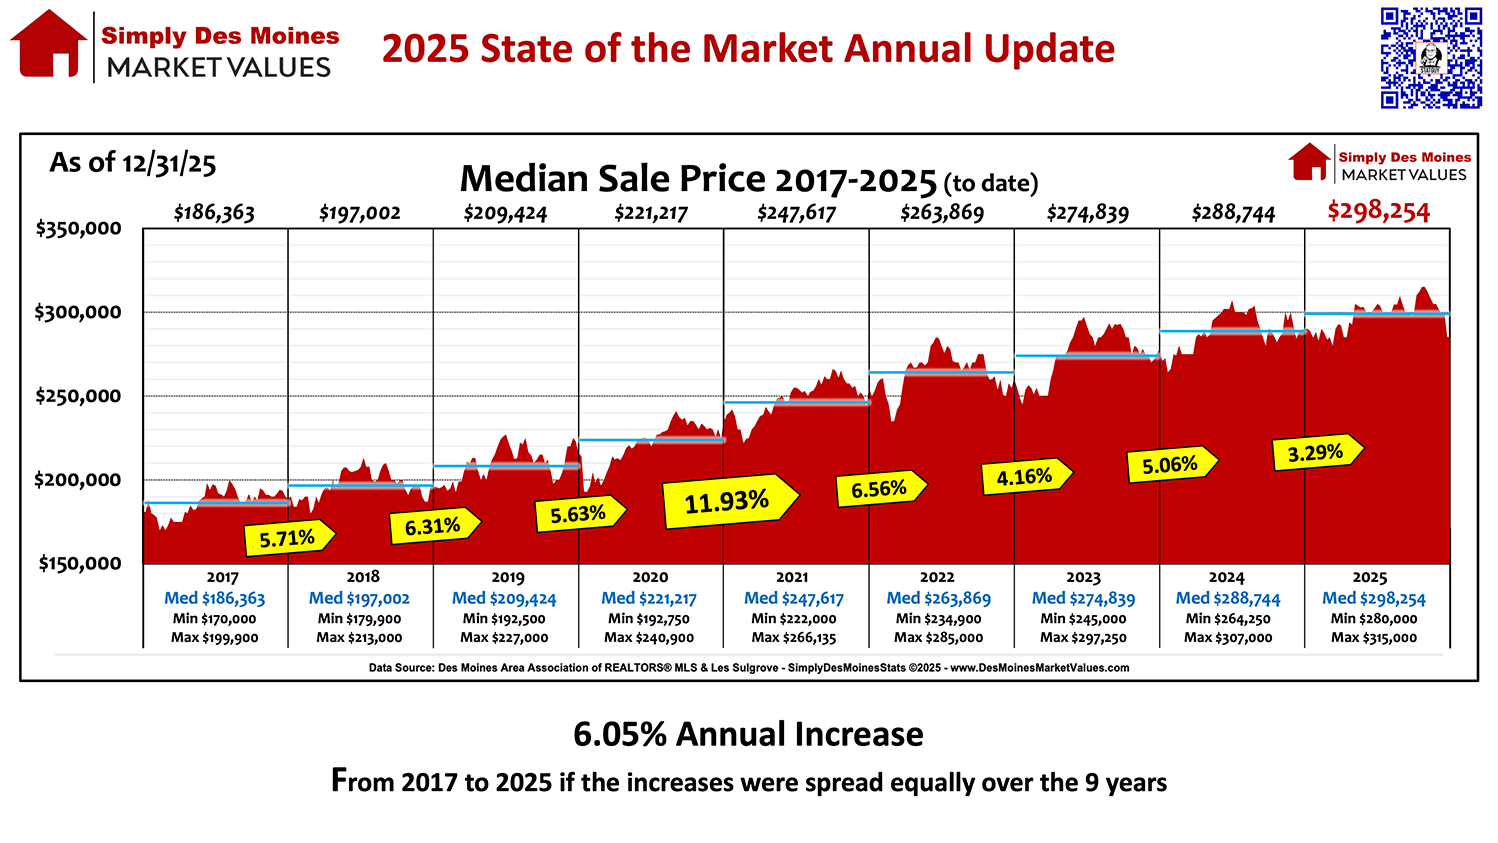
Although that single-year increase was lower than normal, the average over the past decade remains just below 6%, indicating more of a market correction than a warning sign.
As Sulgrove’s presentation came to a close, he offered several slides providing REALTORS® some simple graphics to communicate key information to their clients.
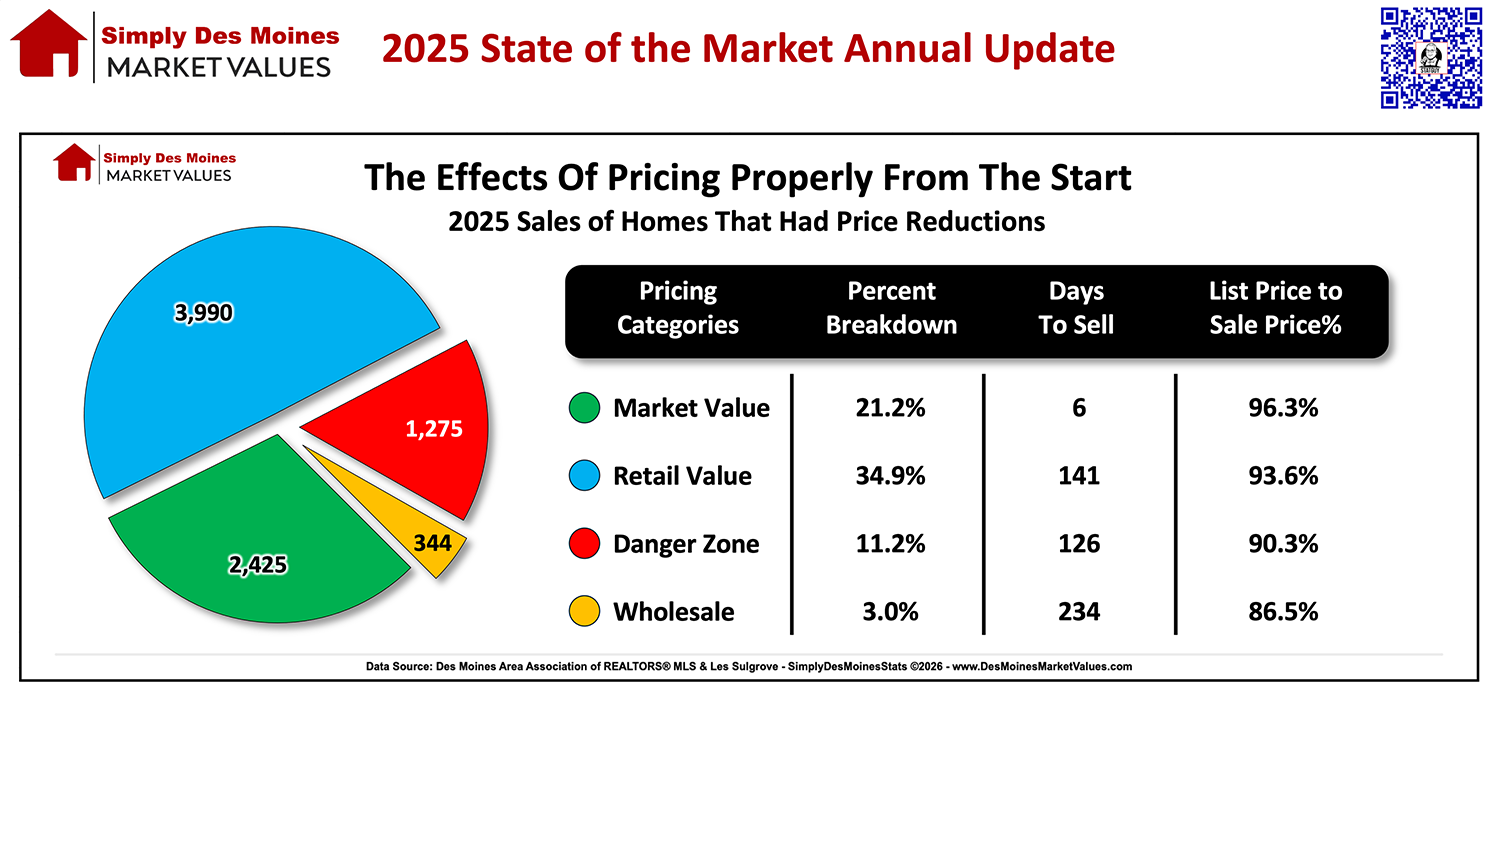
“List price is so important,” he said. “When you compare List Price to Sale Price and Time on Market, it’s obvious that a smart list price pays off. These two slides tell that story pretty clearly. If you take nothing else away from this, share those graphics with your clients.”
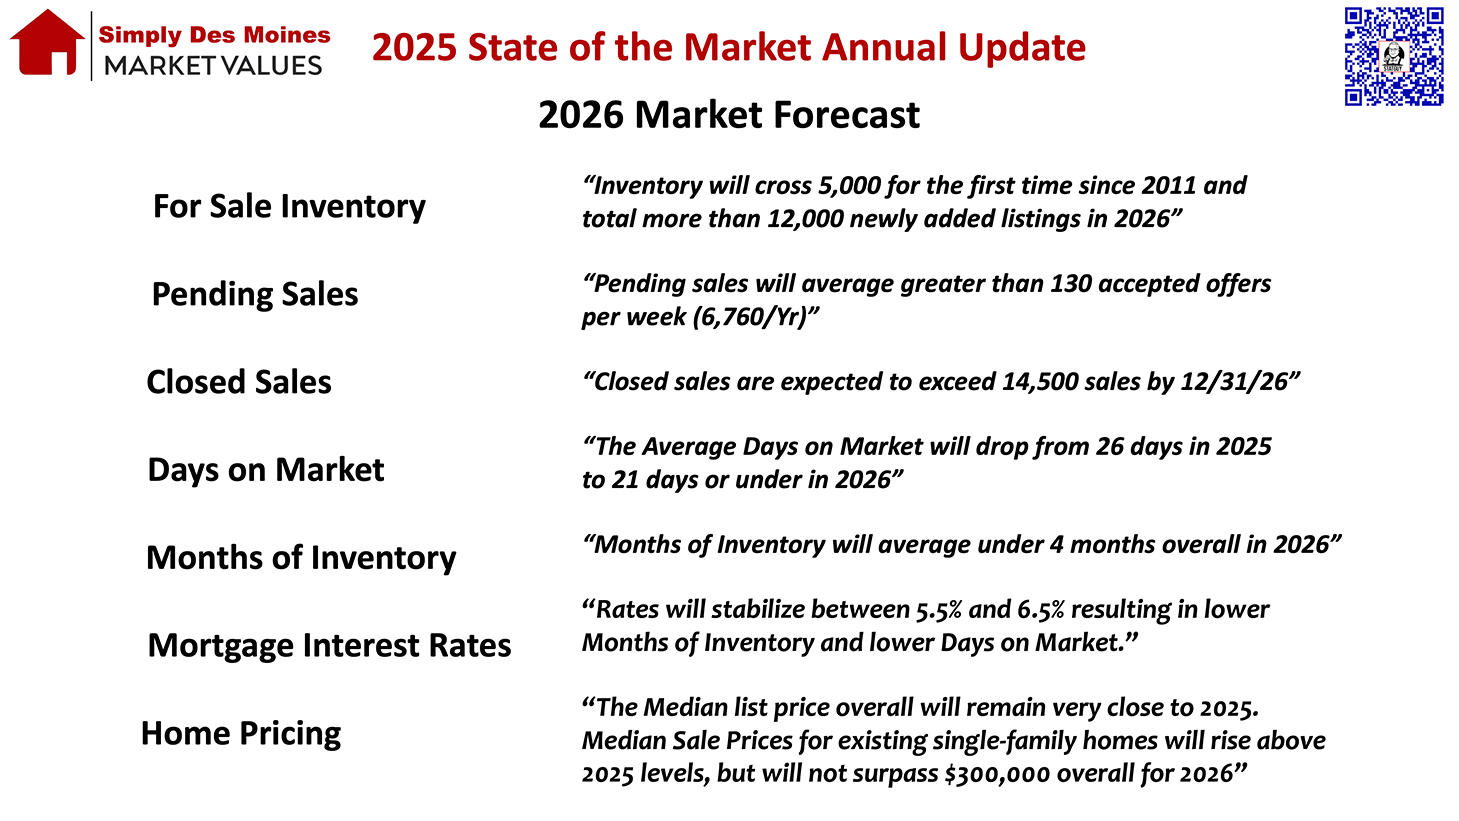
Looking ahead, Sulgrove closed with his annual predictions for the remainder of 2026.
“I admit, I played it safe with some of these predictions. I’d like to come back next year and be able to say I hit more than 50% and that I didn’t go too far out on a limb this time.”
Whatever the market does over the next 12 months, there’s one prediction you can count on: Sulgrove’s 2026 presentation for 2027 is bound to be worth the ticket price.