
Are Home Values Rising in the Des Moines Market?
The short answer is “Yes, No, and It Depends”. With all the hype over how active the real estate market is in Des Moines and central Iowa, I thought it would be a good time to take a look at where home values have ended the first half of 2017.
There’s a common industry saying that “All real estate is local”. I’d like to take that saying one step farther and add that “it’s also more complicated”. If I were to calculate the average sale price of all sales from January 1st, 2017 to June 30th, 2017 and compare that to the same time period a year earlier, the percentage increase would be 5.7%. But that percentage would not be correct. The combination of new construction and the condominiums/townhomes mixed in would skew the numbers.
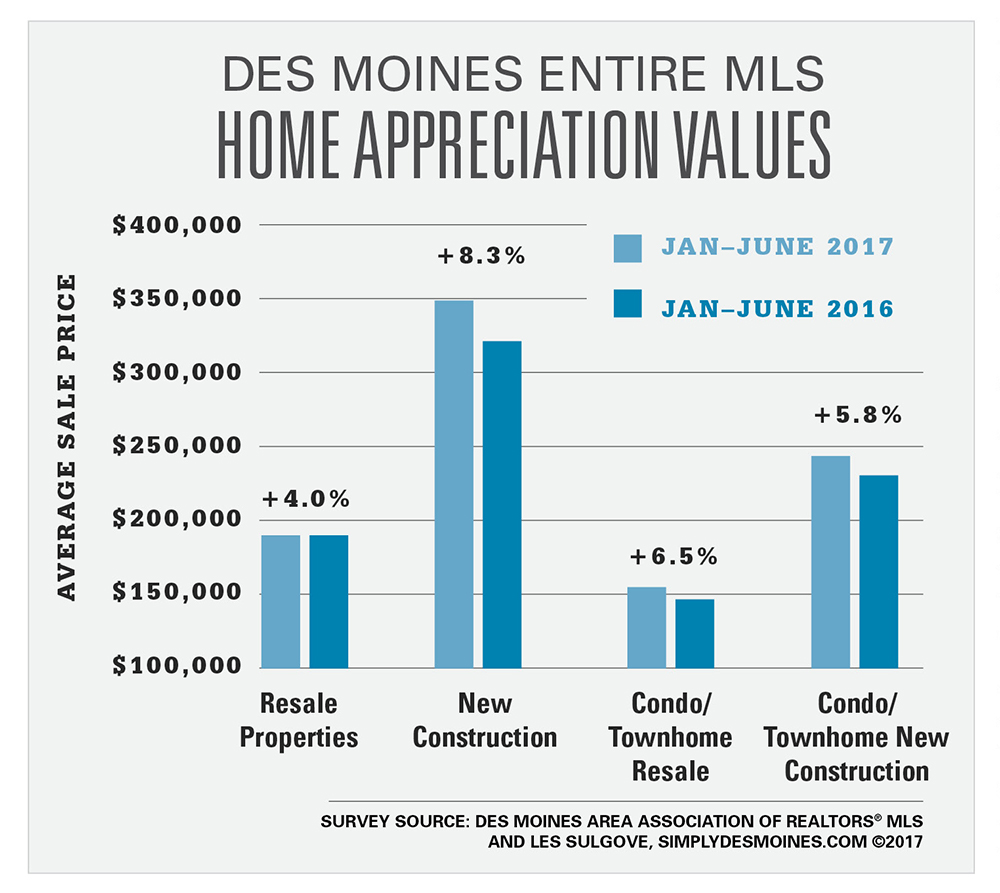
The graph below shows the overall home appreciation rates for resale (pre-owned) and new construction properties also broken down by single family homes and condominium/townhomes. Overall sales of single family resale properties indicate a lower appreciation rate of 4% whereas single family new construction is seeing over 8% increases in values. The average sale price is also much higher for new construction. Condo/Townhome sales of resale and new construction are also showing a pretty high appreciation rate.
What happens when you drill down to specific parts of the city of Des Moines or the suburbs? The chart below breaks down the metro suburbs and divides Des Moines into six geographic areas. The left side of the data set is resale properties of all home styles combined. The right side shows the most popular selling style of homes in that area and the corresponding appreciation or depreciation of home values. The Entire MLS data is highlighted to show how the overall appreciation rate varies from community to community.
The data below shows 3 communities and three areas of the city of Des Moines with double digit increases in values. Clive is showing a slight decline most likely due to the heavy amount of new construction competing there and the east section of Des Moines values are down most likely due to this being some of the oldest home stock in the MLS and lower inventory levels there.
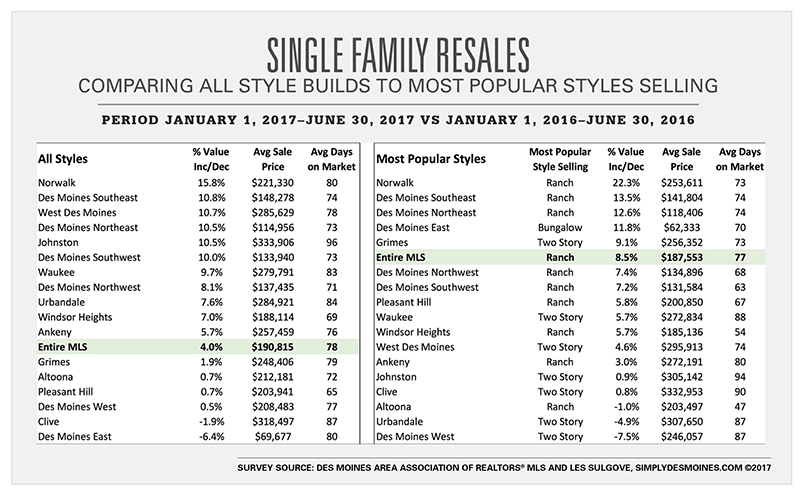
The most popular style home sold in the entire MLS is a ranch home with an increase in values of 8.5%. Norwalk and three areas of Des Moines are all showing double digit appreciation rates while three communities most popular selling styles are seeing values decline over last year.
With seven months of the year under our belt, here are some other benchmark numbers in the Des Moines real estate market as of July 26th.
- The number of homes for sale are on the rise with 3,400 homes on the market. That is up by over 200 since June 30th and up by 500 homes at our lowest inventory point in late March.
- Pending sales peaked in late May but has experienced a surge in new offers during the month of July setting up August to be a record closing month. There are currently 2,757 homes in Pending status compared to 2,592 a year ago (6.4% increase).
- Sold transactions remain ahead of last year by just over 250 sales but as mentioned above, this number will increase as Pendings begin to close in August.
- The Months of Inventory remains in a Seller’s Market currently at 2.6. The increase in new listings coming on the market could drive this number upward if Pending sales begin to slow as we enter into August.
All in all, it’s been a very active real estate year in 2017 in the Des Moines area and barring any outside influences on the economy, I expect the year to end strong.